
The local Arizona housing market has been hot nearly all year long. As we get closer and closer to the year’s end, will the trends continue? We checked out all the stats for Arizona’s market during November. Check out what we found out!
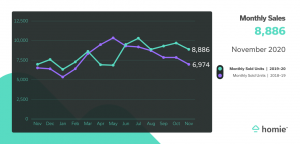
Monthly Sales
According to data from the ARMLS ® from November 1, 2020 to November 30, 2020, monthly sales in the Phoenix metro area rose significantly from where they were at this same time last year. With a +27.4% year-over-year increase, sales landed at 8,886 for the month.
While this number is a slight drop from the previous month of October, the -8.3% month-to-month decrease in sales is in line with the typical slow down in the market as the year starts wrapping up.
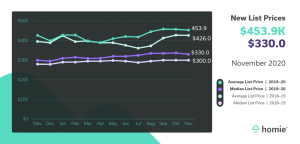
List Price
At $453.9K, November saw a +6.4% year-over-year increase in average list price. Median prices also rose. With a +10.0% increase from November 2019, the median list price in November was $330K.
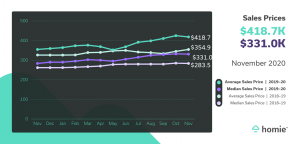
Sale Price
Average sale prices increased by +18.0% between November 2019 and November 2020, landing at $418.7K. With a slightly smaller jump, median sale prices still rose significantly with +16.8% year-over-year increase. The November median sale price was $331.0K.
As forecasts predicted, these numbers are slightly lower than sale prices in October of this year. The average sale price was -1.5% lower than that of October and the median sale price was -1% lower. For next month, the average sale price is projected to increase, while the median sale price is expected to have another small decrease. Check back next month to see how these forecasts turn out.
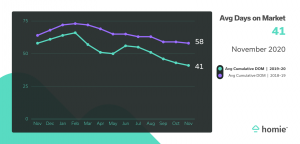
Days on Market (DOM)
While many metrics in the market slowed down this November compared to the previous month, the Average Cumulative Days on Market did not. This number continues to steadily drop, showing homes are being sold more and more quickly. Landing at 41, the Average DOM saw a 2-day decrease from October of this year and a 17-day decrease from November of last year.
Want to Know Your Home’s Value?
If you’re thinking of selling soon, you’re probably wondering how much your home is worth. Click here to request your free home value report from a Homie pro!
A Message From Sales and Operations Manager, Wayne Graham
Going into December, inventory is 28.2% lower than it was a year ago. In fact, some areas are experiencing record low levels of inventory. However, In contrast to the record low levels of inventory, we’re seeing record-high levels of sales. Demand increased by 27.4% between November 2019 and November 2020. Low supply and high demand are one of the surest guarantees of rising sales prices.
But even though prices are rising, according to the National Association of Realtors Housing Affordability Index it is still very affordable to buy a home in Phoenix compared to historical market trends. This is still possible because of extremely low-interest rates. So overall, home affordability is still in a good historical place in the Phoenix area.
Turn to a Homie
With our dedicated team of professionals, we can help you navigate the real estate market easier than ever. Click to start selling or buying with a dedicated and experienced Homie agent.