

A home in one Wasatch Front city was taking about six weeks to sell in mid-2026 while a home a half-hour away was gone in under two. That spread, not the statewide average everyone quotes, is what tells a buyer where the negotiating room actually sits. The longer homes linger in a city, the more its sellers reach for price cuts, rate buydowns, and closing help to get a deal done. This roundup ranks major Wasatch Front cities by median days on market, slowest-moving first, so the places where buyers hold the most leverage sit at the top, each with the read a buyer should take from it. One caution up front: day-count figures come from several trackers that measure “time on market” differently, so treat the numbers below as directional bands drawn from the sources at the end, not precise, comparable stopwatch readings. Verify the current figure for your target city on Redfin before writing an offer.
How were these cities ranked?
Every city is ordered by its approximate 2026 median days on market, from the longest market time to the shortest, using mid-year Redfin, Movoto, and local board data. Longer market times generally mean more buyer leverage, because homes that sit push sellers toward reductions and concessions. Because different trackers count days differently, a city that looks fast on one measure can look slower on another, so the ranking is a rough map of relative leverage rather than a leaderboard down to the day. 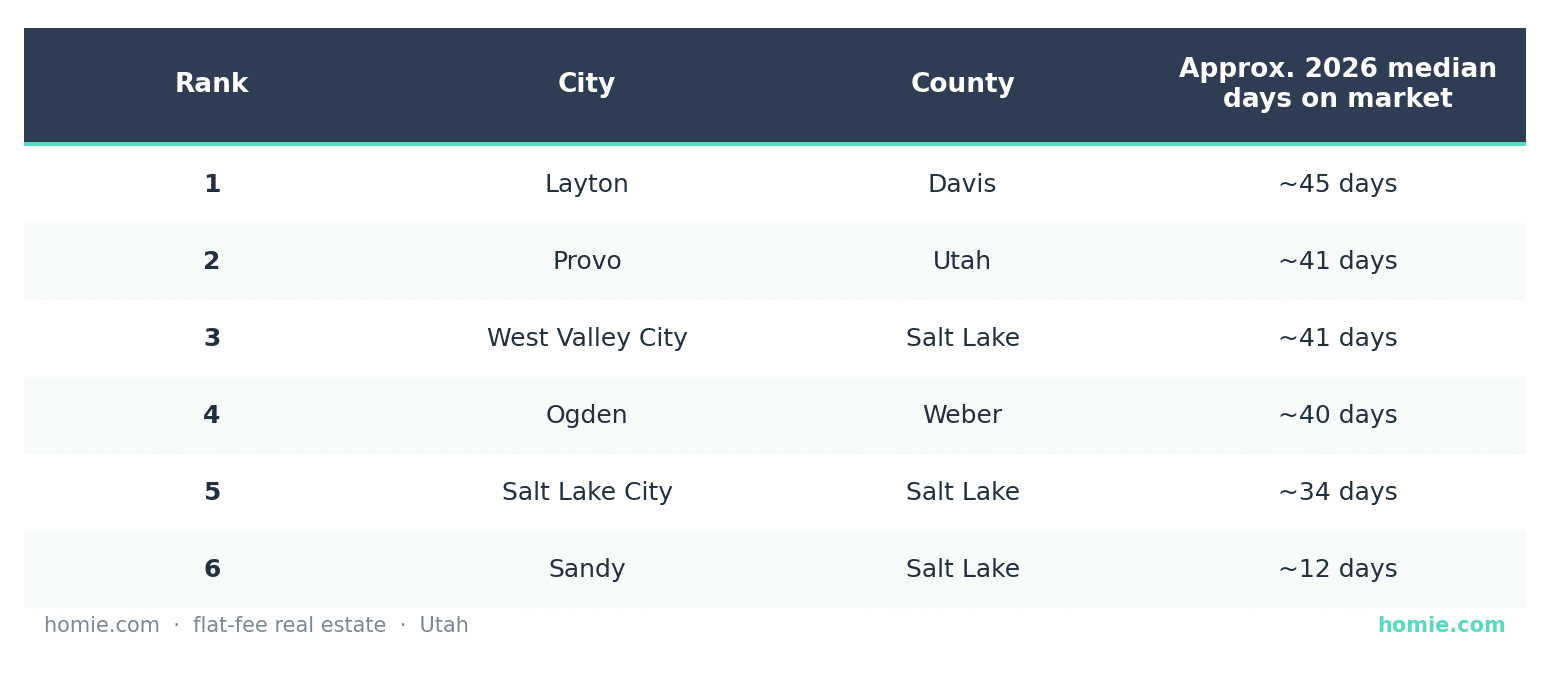 Figures are approximate, drawn from mixed sources with differing methodologies, and move month to month. Confirm current numbers on Redfin.
1. Layton: the longest market times on the Front
Layton ran near a 45-day median in mid-2026, up from about 41 a year earlier, the longest market time among the cities here. Davis County’s Hill Air Force Base demand and FrontRunner commute keep the area steady, but rising inventory has given buyers more room than they had during the frantic years. Where homes sit past six weeks, a buyer has real standing to ask for a price reduction or a seller-paid rate buydown, especially on listings that have already seen a price cut.
- Days on market: ~45.
- Buyer read: the most negotiating room on this list, with well-priced homes still moving faster than the median.
2. Provo: a college-town market that cooled
Provo sat near 41 days on market in 2026, up sharply from about 24 a year earlier, one of the larger year-over-year slowdowns in the group. BYU demand props up entry-level and rental-adjacent housing near campus, but the broader for-sale market has loosened, and homes are taking noticeably longer than they did in 2025. Student-heavy pockets behave on their own rental clock, so read a specific listing rather than the citywide figure.
- Days on market: ~41.
- Buyer read: meaningfully more room than a year ago, with campus-area rentals moving on a different rhythm than family homes.
3. West Valley City: leverage at the county’s entry point
West Valley City ran near a 41-day average in mid-2026, up from about 31 a year earlier, at a median price below the Salt Lake County figure. As the county’s affordable entry point, it draws steady first-time and commuter demand, but the longer market time signals that even value-tier buyers have gained negotiating room. The gap between the average and shorter medians some trackers report is wide here, so confirm the measure before leaning on it.
- Days on market: ~41 (average; some trackers show shorter medians).
- Buyer read: an affordable price band with more time to negotiate than a year ago.
4. Ogden: steady, with a touch more room
Ogden held near 40 days on market in 2026, roughly flat against about 39 a year earlier, one of the more stable readings on the list. Weber County’s historic-downtown appeal and lower price band keep demand consistent, and the near-flat market time suggests leverage grew less here than in the fast-cooling markets. Buyers still find room on listings that have sat, but the citywide pace is closer to balanced than to a buyer’s market.
- Days on market: ~40.
- Buyer read: balanced and steady, with leverage on specific aged listings rather than across the board.
5. Salt Lake City: the county benchmark
Salt Lake County homes were selling in a median near 34 days in 2026, up from about 29 a year earlier, and the city itself tracks close to that benchmark. Core demand, walkable neighborhoods, and limited new-construction supply keep homes moving faster than the outer commuter cities. Buyers still negotiate on listings that overshoot the market, but the citywide numbers hand sellers a firmer footing than Davis or Weber County.
- Days on market: ~34.
- Buyer read: firmer than the commuter cities, with leverage on a listing-by-listing basis.
6. Sandy: the fastest-moving market here
Sandy posted some of the shortest market times on the Front in 2026, with medians reported around 12 days on the measures that track quickest-to-contract, though the figure swings hard by price band. The east-bench schools and Cottonwood canyon access keep desirable Sandy homes in high demand, which compresses market time and trims a buyer’s leverage. Room to negotiate here comes from a specific overpriced or long-sitting listing, not from the market at large.
- Days on market: ~12 (varies widely by price range and measure).
- Buyer read: the tightest market on this list, where leverage is the exception rather than the rule.
Frequently Asked Questions
Which Wasatch Front city has the longest days on market in 2026?
Among the cities here, Layton showed the longest market time, near a 45-day median in mid-2026, followed closely by Provo and West Valley City around 41 days. Longer market times generally mean more room to negotiate, since sellers of homes that sit tend to offer price cuts or concessions. Day-count methods vary by tracker, so confirm the current figure for your target city on Redfin before relying on it.
Where do buyers have the most leverage on the Wasatch Front?
In 2026, the Davis and Weber County cities and the county’s affordable entry points, especially Layton, Ogden, and West Valley City, generally offered more negotiating room as inventory rose and market times lengthened. Core Salt Lake City and high-demand east-bench Sandy moved faster and gave sellers firmer footing. Leverage still varies listing by listing, so read the specific home’s price history and time on market rather than assuming one citywide number.
Why do days-on-market figures differ so much between sources?
Because trackers define “time on market” differently. Some count median days to go under contract, others average days until closing, and some reset the clock when a listing is relisted, so the same city can look like 12 days on one site and 41 on another. Use one consistent source when comparing cities, and treat any single number as directional rather than exact.
Does a longer time on market mean I can offer less?
Often, but not always. A home that has sat well past its city’s median is more likely to draw a price cut, a rate buydown, or closing-cost help, especially where inventory is rising. But some homes linger because they are overpriced or have real problems, not because the seller is motivated. Read days on market alongside price history, the list-to-sale ratio, and local inventory before setting your offer.
What is my Wasatch Front home worth?
Run a free automated estimate on Zillow, Redfin, or Homie’s home value report, then adjust for your city, neighborhood, and sold comps within a mile. Market times and prices vary sharply from Layton to Sandy, so a Front-wide figure is a weak proxy for any single address. For a high-confidence number before listing, a Utah-licensed appraiser typically runs a few hundred dollars.
That’s the leverage map of the Front. If you’re buying along the Wasatch Front and want a brokerage that will help you read days on market and time an offer before you tour, homie.com/buy is a good place to start. We’re a licensed Utah real estate brokerage. Day counts here are approximations from mixed sources, so confirm current figures on Redfin before you write an offer.
— The Homie Team
*All brokerage fees, including listing and buyer agent compensation, are fully negotiable and determined solely by the seller and service provider. *Flat-fee pricing and service availability may vary by location and are subject to change over time. Verify current pricing before listing. *Past performance is not indicative of future results. *Examples and potential savings are for illustrative purposes only.
- Redfin, Salt Lake County housing market
- Redfin, Ogden housing market
- Movoto, West Valley City market trends
- Movoto, Layton market trends
- Best Utah Real Estate, Sandy market report
- Community research: r/SaltLakeCity and r/UtahRealEstate market threads