
It’s hot outside and so is the market!
“Hottest Summer ever in Phoenix recorded history and also the hottest July ever for real estate sales in the Greater Phoenix area. Our market is smoking! In the last 20 years, monthly sales have topped 10,000 only four previous times. July 2020 has reached this milestone with 10,303 sales!” -Wayne Graham, Head of Real Estate Operations at Homie Arizona.
Monthly Sales
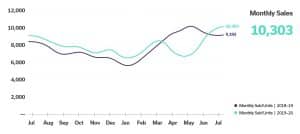
According to the data from the ARMLS® from July 1, 2020 to July 31, 2020, real estate sales are up +8.4% month-over-month . The year-over-year comparison is up +12.1% at 10,303 compared to 9,192 in 2018-19.
List Price
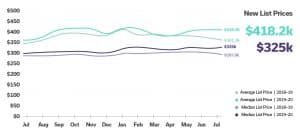
Average new list prices are up +15.7% at $418.2K compared to $361.3K in 2018-19. The year over-year median is up +12.9% at $325K, compared to $287.9K in 2018-19.
Sale Price
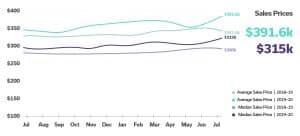
Home values are staying strong. The average sales price is up +14.6% year-over year at $391.6K, compared to $341.6K in 2018-19. While the year-over year median sales price is also up +12.5% at $315K compared to $280K in 2018-19.
Days on Market (DOM)
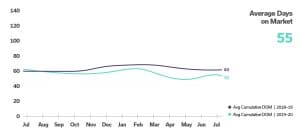
We saw the Average Cumulative Days on Market decrease in July 2020-19, averaging 55 days on market versus 63 Average Cumulative Days on Market in 2018-19. At Homie, we are continuing to see sellers getting multiple offers on their homes.
July Breaks Records in 2020
A message from our Associate Broker, Jennifer Hull:
For Buyers
It’s a jungle out there for buyers! Despite recent appreciation rates the Home Opportunity Index* measure for the Greater Phoenix market increased to 64.8% for the 2nd Quarter in 2020; the previous measure was 63.0%. This means that a household making the current median family income of $72,300 per year could afford 64.8% of what sold in the 2nd Quarter of 2020. By comparison, the HOI measure for the United States was 59.6%.
Historically, a normal range for this measure is between 60-75%. During the bubble years of excessive appreciation between 2005-2006, the HOI plummeted from 60.1% to 26.6%. Typically if it falls below 60%, the market should start to see a drop in demand. With the most recent increase however, Greater Phoenix is still within normal range and experiencing demand 20% above normal for this time of year.
What makes this market significantly different from the infamous bubble and crash is the relation between resale housing growth and population growth. In the early 2000’s, housing was growing faster than the population and creating a surplus. This surplus went unnoticed due to excessive speculator (i.e. “false”) demand fueled by loose lending practices. When loans tightened up, the surplus came roaring into focus as vacant inventory soared to over double the normal levels. However since 2006, the population has grown faster than housing. It has taken 14 years, but the population growth fueled by job growth has finally consumed the surplus of resale housing created during the bubble years and now the market is facing a shortage of homes for sale.
This type of market and appreciation is not sustainable long term, however it’s here now and properties purchased today are expected to continue appreciating over the next 6-12 months.
For Sellers
So much for the summer slowdown, July had a record number of closings go through the Arizona Regional MLS; surpassing every July as far back as 2001. July also had record breaking sales in dollar volume with $3.9B sold. The best July ever recorded prior was in 2005 at $2.9B. The monthly appreciation rate finalized 12.5% higher than 2019 and was the 4th highest appreciation rate for July going back to 2001.
“One third of homes closed were over asking price and only 15% involved any sort of seller-paid closing cost assistance; down from a high of 27% last May. Half of all sellers who accepted contracts in the first week of August did so with 7 days or less on the market.
Contracts on luxury homes over $1M are up an incredible 93% over last year at this time. Between $500K-$1M, contracts are up 64%. Between $300K-$500K, they’re up 39%. Between $250K-$300K, up 15%. If you need to sell, this is indeed the time to do it!” -Jennifer Hull, Associate Broker at Homie Arizona.
Want to Know Your Home’s Value?
Want to know how much your home is worth? Click here to request your home value report.
Turn to a Homie
Homie has local real estate agents in all of our service areas. These agents are pros in everything they do, including understanding the local real estate market. Click to start selling or buying and to get in touch with your dedicated agent.